I developed a set of models to explain, estimate, and predict home prices. My second modeling objective was to benchmark the accuracy in testing (prediction) of simple OLS regression models vs. more complex DNN model structures.
I won't spend any time describing in much detail the data, the explanatory variables, etc. For that you can look at the complete study at the following links. The study is pretty short (about 20 slides).
Housing Price models at Slideshare
Housing Price models at Slidesfinder
Just to cover the basics, the dependent variable is home prices in April 2022 defined as the median county zestimate from Zillow, that I just call zillow within the models. The models use 7 explanatory variables that capture income, education, innovation, commute time, etc. All variables are standardized. But, final output is translated back into nominal dollars using a scale of $000.
The models use data for over 2,500 counties.
I developed four models:
1. A streamlined OLS regression (OLS Short) that uses only three explanatory variables. It worked as well as any of the other models in testing/predicting;
2. An OLS regression with all 7 explanatory variables (OLS Long). It tested & predicted with about the same level of accuracy as OLS Short. But, as specified it was far more explanatory (due to using 7 explanatory variables, instead of just 3);
3. A DNN model using the smooth rectified linear unit activation function. I called it DNN Soft Plus. This model structure had real challenge converging towards a solution. Its testing/predicting performance was not any better than the OLS regressions;
4. A DNN model using the Sigmoid activation function (DNN Logit). And, this model will be the main focus of our analysis regarding overfitting with DNNs.
The DNN Logit was structured as shown below:

I purposefully structured the above DNN to be fairly streamlined in order to facilitate convergence towards a solution. Nevertheless, this structure was already too much for the DNN Soft Plus (where I had to prune down the hidden layers to (3, 2) in order to reach mediocre convergence (I also had to rise the error level threshold).
When using the entire data set, the Goodness-of-fit measures indicate that the DNN Logit model is the clear winner.

You can also observe the superiority of the DNN Logit visually on the scatter plots below.

On the scatter plot matrix above, check out the one for the DNN Logit at the bottom right; and focus on how well it fits all the home prices > $1 million (look at rectangle defined by the dashed red and green lines). As shown, the DNN Logit model fits those perfectly. Meanwhile, the 3 other models struggle in fitting any of the data points > $1 million.
However, when we move on to testing by creating new data (splitting the data between a train sample and a test sample), the DNN Logit performance is mediocre.

As shown above when using or creating new data and focusing on model prediction on such data, the DNN Logit predicting performance is rather poor. It is actually weaker than a simple OLS regression using just 3 independent variables.
Next, let's focus on what happened to the DNN Logit model by looking how it fit the "train 50%" data (using 50% of the data to train the model and fit zestimates) vs. how it predicted on the "test 50%" data (using the other half of the data to test the model's prediction).
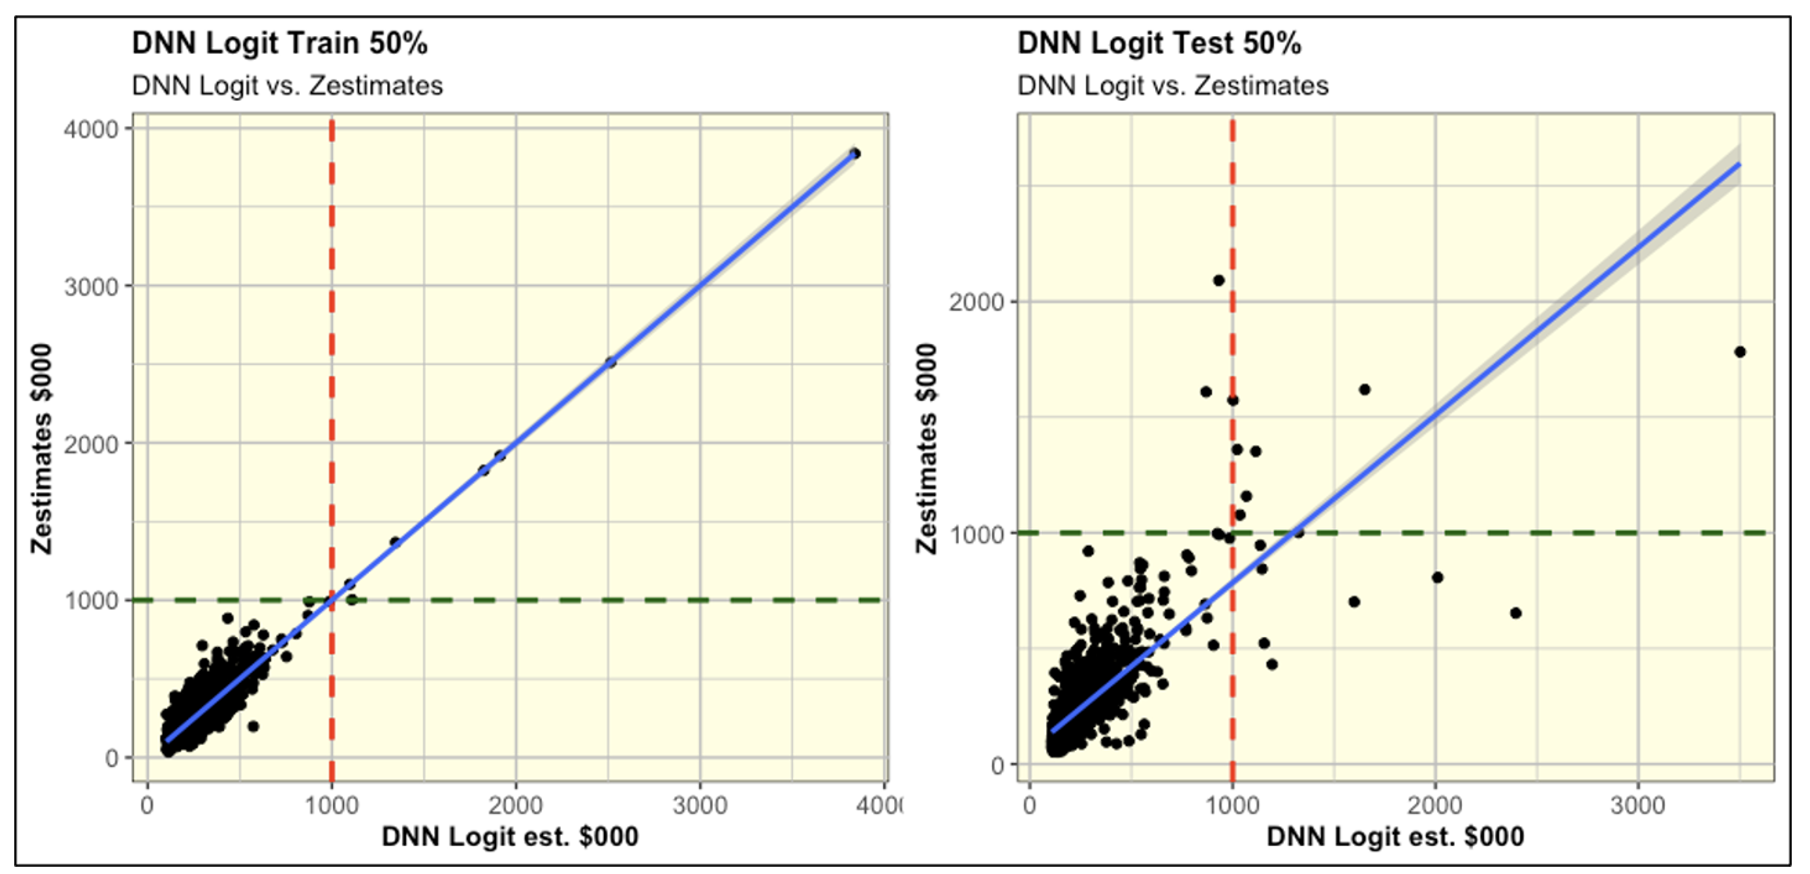
As shown in training, the DNN Logit model perfectly fit the home prices > $1 million. At such stage, this model gives you the illusion that its DNN structure was able to leverage non linear relationships that OLS regressions can't.
However, these non linear relationships uncovered during training were entirely spurious. We can see that because in the testing the DNN Logit model was unable to predict other home prices > $1 million within the test 50% data.
The two scatter plots above represent a perfect image of model overfitting.


No comments:
Post a Comment