Wednesday, January 19, 2022

Comparing R vs. Python graphing capabilities for time series data

 I used a simple time series data set on the number of touch downs for seven different quarterbacks achieved over the years.  The x-axes of the graphs are the quarterbacks' respective age.  The y-axes are their respective cumulative number of touch downs.  

You can see the complete presentation at the link below: 

R vs. Python comparison

And, I compare the two software using different types of graphs, including:

1) Time series graph of a single variable (the number of touch downs for one single quarterback);
2) Time series graph of multiple variables (including all 7 quarterbacks); and 
3) Facet graphs when you generate a separate graph for each of the quarterbacks. 

For the first two types of graphs, the two software were pretty competitive.  R was a bit more efficient in generating legends almost automatically.  Meanwhile, constructing a legend using Python was a lot longer and manual.  But, otherwise the respective Python graphs were pretty competitive with the R ones in terms of look and feel.  And, the coding difficulty (besides the legend bit) was fairly similar. 

When it came to Facet graphs, there was no comparison.  R was far easier and better.  Python facet graph capabilities appear more structured for scatter plots and not so much for time series plots.  Doing the latter in Python was truly a miserable experience.  And, the result was so poor relative to the R facet graphs, that I don't even dare to show them here.  I show them within the presentation link above.  With superior Python coding skills, maybe facet-time series graphs are doable.  But, be warned.  There is high hurdle rate there in terms of coding skills.  

Here is a multi variables regular Python graph that came out very well.


Here is the comparable R graph that came out equally well. 


Here is an R facet graph that came out very well. 


Thursday, January 13, 2022

Will stock markets survive in 200 years? Some won't make it till 2050


Within a related study “The next 200 years and beyond” (see URLs below), 


The next 200 years at Slideshare


The next 200 years at SlidesFinder


... we disclosed that population and economic growth can’t possibly continue beyond just a few centuries.


Just considering what seems like a benign scenario: 


 Zero population growth with a 1% real GDP per capita growth … 


… would result in the World economy becoming 8 times greater within 288 years and 16 times greater within 360 years.  Thus, the mentioned scenario, as projected over the long term, is not feasible.  


This study contemplates how will stock markets survive in the absence of any demographic and economic growth.  The whole body of finance supporting stock markets (CAPM, Dividend Growth model, Internal Rate of Return, Net Present Value) evaporates in the absence of a growth input (market rate of return, dividend growth, etc.). 


And, current trends over the past few decades confirm the World is already heading in that direction.  In our minds, this raised existential considerations for stock markets. 


This study uncovered several stock markets that already experience current and prospective growth constraints.  And, the survival of several of those markets till 2050 appear questionable. 


Place yourself in the shoes of college graduates entering the labor force and investing in their 401K for retirement.  The common wisdom is to invest the majority of such funds in the stock market to reap maximum growth over the long term.  Such a well established strategy, would most probably not work out for the majority of the 11 markets reviewed.  And, it could be devastating if the college grad lives in Greece, Italy, or Ukraine. 


Similar considerations, within the same mentioned countries, would affect any institutional investors focused on the long term such as pension funds, endowment funds, insurers, retail index fund investors, etc.


In the US, we may be spared these bearish considerations, but for how long?  A century or two from now, we in the US may be affected by the same considerations.  


You can see the complete study at the following link below: 

 Stock market in 200 years at Slideshare


Wednesday, December 29, 2021

Standardization

 The attached study answers three questions: 

  1. Does it make a difference whether you standardize your variables before running your regression model or standardize the regression coefficients after you run your model? 
  2. Does the scale of the respective original non-standardized variables affect the resulting standardized coefficients? 
  3. Does using non-standardized variables vs. standardized variables have an impact when conducting regularization? 

The study uncovers the following answers to those three questions:

  1. It makes no difference whether you standardize your variables first or instead standardize your regression coefficients afterwards. 
  2. The scale of the original non-standardized variables does not make any difference.
  3. Using non-standardized variables when conducting regularization (Ridge Regression, LASSO) does not work at all.  In such a situation (regularization) you have to use standardized variables. 

To check out the complete study (very short just 7 slides) go to the following link.  

Standardization study at Slideshare.net

Thursday, December 23, 2021

Is Tom Brady the greatest quarterback?

 If you want to review the entire study, you can view it at the following links: 

Football study at Slideshare.net

Football study at SlidesFinder.com 

The above studies include extensive use of the binomial distribution that allows differentiating how much of the quarterbacks' respective records are due to randomness vs. how much is due to skills.  This statistical analysis is not included within this blog post.  (The study at SlidesFinder may not include this complete section right now, but it should within a few days). 

The quarterbacks I looked at include the following: 


Performance during the Regular Season.

If we look at Brady's performance during the regular season at mid career (34 years old), he actually is far behind many of his peers.  

First, let's look at cumulative yards passed by 34 years old. 


Next, let's look at number of touch downs by 34 years old. 


As shown above in both yards and touch downs, at 34 years old Brady is way behind Manning, Marino, Brees, and Favre.  

At this stage of his career and on those specific counts, Brady does not look yet earmarked to become a legendary number 1.  

However, Brady's career longevity and productivity is second to none.  And, when you compare the respective records over an entire career, the picture changes dramatically. 


 Brady's ability to defy traditional age sports curve is remarkable.  He just has not shown any decline in performance in age.  At 44, he is just as good as 34... unlike any of his peers who have been out of the game for years. They all retired by 41 or earlier. 
 
 
Track record during the Post-Season.  

During the Post-Season it is a very different story.  Brady has been dominant throughout and since early on in his career.  He leads in number of Play Offs. 


He is way ahead in number of Super Bowl games. 


And, way ahead in Super Bowl wins. 


The table below discloses the performance of the players during the Post-Season. 

Given the number of teams in the NFL (32), and number of seasons played, the above players have a random proportional probability of winning one single Super Bowl ranging from 50% (for Montana) to 66% (for Brady).  That probability based on just randomness drops rapidly to close to 0% of winning 2 Super Bowls.  Notice that Marino, Brees, and Favre actual records are in line with this random proportional probability.  This underlies how truly difficult it is to win more than one Super Bowl.  Manning and Elway do not perform much above this random probability.  Only Montana and Brady perform a heck of a lot better than random probabilities would suggest based on the number of seasons they played. And, as shown Brady with 7 is way ahead of Montana.  And, he is not done!

When looking at the Post-Season track record, there is no doubt that Brady is the greatest.  Under pressure, and when it counts he scores.  Also, interesting even when he looses in a Super Bowl game, it is a close game.  He does not get wiped out.  By contrast some of the other quarterbacks (including Marino, and Elway among others) suffered truly humiliating lopsided defeats in the Super Bowl... not Brady.


Friday, December 10, 2021

Why you should avoid Regularization models

 This is a technical subject that may warrant looking at the complete study (33 slides Powerpoint).  You can find it at the two following links. 

Regularization study at Slideshare.net

Regularization study at SlidesFinder.com 

If you have access to Slideshare.net, it reads better than at SlidesFinder. 

Just to share a few highlights on the above.  

The main two Regularization models are LASSO and Ridge Regression as defined below. 


The above regularization models are just extension of OLS Regression (yellow argument) plus a penalization term (orange) that penalizes the coefficient levels.  

Regularization models are deemed to have many benefits (left column of table below).  But, they often do not work as intended (right column of table below).


In terms of forecasting accuracy, the graphs below show the penalization or Lambda level on the X-axis.  As Lambda level increases from left to right, penalization increases (regression coefficients are shrunk and eventually even zeroed out in the case of LASSO models).  And, the number of variables left in the LASSO models decreases (top X-axis).  The Y-axis shows the Mean Squared Error of those LASSO models within a cross validation framework. 


The above graph on the left shows a very successful LASSO model.  It eventually keeps only 1 variable out of 46 in the model, and achieves the lowest MSE by doing so.  By, contrast the LASSO model on the right very much fails.  Close to the best model is when Lambda is close to Zero which corresponds to the original OLS Regression model before any Regularization (before any penalization resulting in shrinkage of the regression coefficients). 

Revisiting these two graphs and giving them a bit more meaning is insightful.  The LASSO model depicted on the left graph below was successful as it clearly reduced model over-fitting as intended as it increased penalization and reduced the number of variables in the model.  The LASSO model on the right failed as it increased model under-fitting the minute it started to shrink the original OLS regression coefficients and/or eliminated variables.


Based on firsthand experience the vast majority of the Ridge Regression and LASSO models I have developed resulted in increasing model under-fitting (right graph) instead of reducing model overfitting (left graph). 

Also, when you use Regularization models, they often destroy the original explanatory logic of the original OLS Regression model. 

The two graphs below capture the regression coefficient paths as Lambda increases, penalization increases, and regression coefficients are progressively shrunk down to close to zero.  The graph on the left shows Lambda or penalization increasing from left to right.  The one on the right shows Lambda increasing from right to left.  Depending on what software you use, those graphs respective directions can change.  This is a common occurrence.  Yet, the graphs still remain easy to interpret and are very informative. 


The above graph on the left depicts a successful Ridge Regression model (from an explanatory standpoint).  At every level of Lambda, the relative weight of each coefficient is maintained.  And, the explanatory logic of the original underlying OLS Regression model remains integer.  Meanwhile, on the right graph we have the opposite situation.  The original explanatory logic of the model is completely dismantled.  The relative weight of the variables dramatically change as Lambda increases.  And, numerous variables coefficients even flip sign (from + to - or vice versa).  That is not good. 

Based on firsthand experience several of the Regularization models I have developed did dismantle the original explanatory logic of the underlying OLS Regression model.  However, this unintended consequence is a bit less frequent than the increasing of model under-fitting shown earlier. 

Nevertheless for a Regularization model to be successful, it needs to fulfill both conditions: 

a) Reduce model overfitting; and

b) Maintain the explanatory logic of the model.  


If a Regularization model does not fulfill both conditions, it has failed.  I intuit it is rather challenging to develop or uncover a Regularization model that does meet both criteria.  I have yet to experience this occurrence. 

Another source of frustrations with such models is that you can get drastically different results depending on what software package you use (much info on that subject within the linked Powerpoint). 

One of the main objectives of Regularization is to reduce or eliminate multicollinearity.  This is such a simple problem to solve by simply eliminating the variables that appear superfluous within the model (much info on that within the Powerpoint) and are multicollinear to each other.  This is a far better solution than using Regularization models that are highly unstable (different results with different packages) and that more often than not fail for the mentioned reasons.

Tuesday, November 23, 2021

Is the 3-points game taking over NBA basketball

 The short answer is not yet.  The graph below shows that 2-points still make over 50% of overall points.  Granted, 3-points have steadily risen since the 1979-1980 NBA season when 3-points were first introduced in the NBA.  It took a while for the players to adapt their skills and coaches to evolve their strategies to leverage the benefits of 3-points shots. 

 
The big difference over time is how much more aggressive players have become in attempting 3-points shots.  Until the 2011 - 2012 season, teams were attempting less than twenty 3-points shots per game.  The number has exploded to over 35 during the most recent two seasons. 
 

 Something to keep in mind is that the 3-points shooting skill of a team has only a rather moderate to weak relationship with a team's overall performance or ranking.  And, that is another way to consider that 3-points shooting is not dominant in the NBA or even determinant in NBA team's success. 


The graph above (using the NBA 2020-2021 season data) indicates that 3-points ranking of a team explains only 15% of the variance in the overall ranking of a team (R Square = 0.1485) and vice versa.  If 3-points ranking explained 100% of the overall ranking, the red regression trend line would be perfectly diagonal across the squares on the grid.  And, the regression equation would be: y = 1(x) + 0.  Or in plain English: 3-points ranking = Overall ranking.  As shown, this is far from this situation.  
 
Here are the top 5 leaders in 3-points baskets.  

Notice that two of them are still active: Stephen Curry (33 years old), and James Harden (32).  One would expect Curry to soon become the top leader; and, James Harden to move into the third spot.  By the end of their respective career, Curry and Harden may very well occupy the top 2 spots. 

A closer look at the top 5 record on a per game basis. 

What tables A and B indicate is that the contemporary players (Curry and Harden) have been far more productive in scoring 3-pts shots.  And, the main reason behind their success is that they have been far more aggressive in attempting 3-pts shots (see table B). 

In terms of accuracy (table C for 3-pts success rate), Kyle Korver, a player from another generation pretty much towers over the field.  But, his higher success rate did not matter much given that he made so fewer 3-points attempts per game than Curry and Harden (see table B). 

Curry's 3-points talent is in good part not reflected in any of the above statistics.  Curry differentiates himself from the field with his unique ability to score 3-points baskets from "way downtown", often at or even past mid-court.  Unfortunately, this superlative achievement is not rewarded with any scoring points benefits.  

Harden is a very different player.  While nearly as aggressive as Curry in attempting 3-points shots (table B).  He is not nearly as accurate (lower success rate as shown in table C).  In recent seasons, Harden has also somewhat lessened his focus on 3-points shots attempts (table B).  On the other hand, Harden is a very dynamic and diversified player.  And, his claim to fame may not be just his 3-points shooting skills, but his mesmerizing dribbling across his legs in a crouching tiger type position that has rendered him the most "unguardable" player in the NBA.  

Next question worth considering is how long can we expect Curry to perform at top level in 3-points shooting?  

Well, the short answer is for a pretty long time.  The graph below shows the record of Ray Allen, Reggie Miller, and Kyle Korver who rounded the top 5 in 3-points shooting.  We looked at their 3-points success per game (number of baskets) and their related success rate.  The graph shows their respective performance as they aged.  We used the average of their respective performance over 6 seasons when they were from 28 to 33 years old.  We used this average as a baseline index = 100.  And, next we divided each year specific performance by the 28 -33 average and multiplied it by a 100.  This allowed us to measure precisely how their respective performance declined as they aged beyond 33 years old. 


The left hand graph shows that Miller and Korver maintained their 3-points success per game very well as they aged.  At 38 years old, they were still performing at 80% of their average level at 28 to 33 years old. 

The right hand graph shows that all three players maintained their respective 3-points success rate remarkably well as they aged.  Shooting accuracy just does not seem to deteriorate with age.  
 
Curry is now 33.  In view of the above, it is rather likely that he would be very close to or at top form over the next three years (34, 35, 36).  Beyond 36, he may experience a mild decline in 3-points success per game.  But, he may still be relatively formidable in that category compared to other players. 
 
We could say the same thing for Harden (32).  However, Harden has apparently been much less focused on 3-points shooting during the most recent two seasons. 
 
I actually do not follow basketball.  Seeing everyday pictures of Curry on the cover of the sport page of my daily newspaper, I eventually caught Curry fever.  In view of that, I welcome comments, corrections.  And, I would gladly edit and improve this blog entry over time.  
 
If you want to read my complete study on the subject, check the two links below. 


Thursday, November 18, 2021

Is Japan indicative of the future of the US?

Japan leads the US towards a path associated with:
a) a decreasing fertility rate much below replacement rate;
b) an aging society;
c) a declining population growth;
d) a slowing economy; and
e) an increasingly leveraged Public finance position (large Budget Deficits, very high Public/Debt ratio).

However, the two countries are likely to continue diverging materially on several counts:


a) The US population growth is already declining.  But, it is likely to remain positive and much above Japan.  That is because the US benefits from a robust net migration of close to + 1.5% of the population per year vs. only 0.5% for Japan; 


b) Health status and healthcare costs metrics will likely continue to show Japan with far better health outcome associated with far lower health care costs.  This is in good part because of the inputs.  Japanese are far healthier than Americans.  And, these divergences appear likely to continue; 


c) Japan is likely to continue outperforming the US on primary school indicators; 


d) The US is likely to continue outperforming Japan on university level indicators and the generation of science and engineering degrees and papers. 


I have conducted a detailed analysis of all of the above that I share at: 

Study at Slideshare.net

Study at SlidesFinder  

I share these two different platform access options, as I don't know which one is easiest to access.

Below I am sharing just a few of the key slides of this analysis.
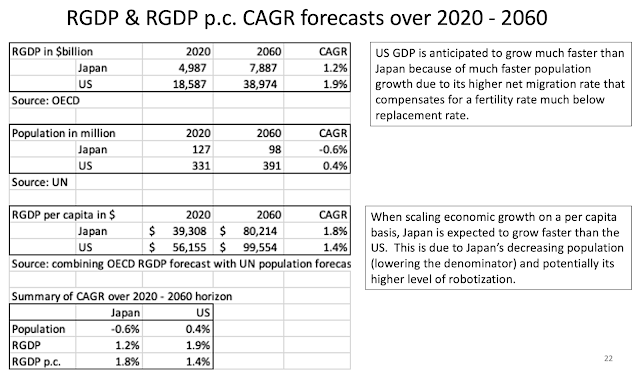
The slide below discloses that over the next 40 years, the US population and economy is anticipated to grow much faster than Japan, mainly due to the US higher net migration.  However, Japan's Real GDP per capita is expected to grow faster than the US.


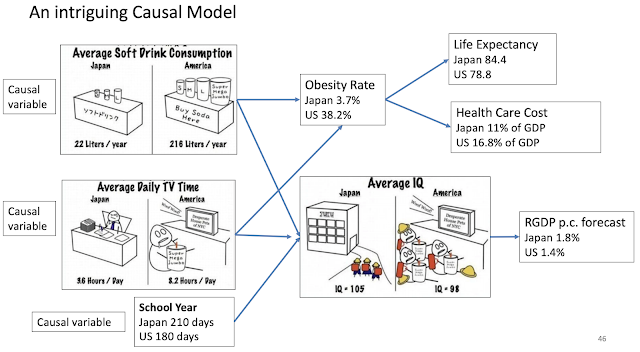
This next slide is an intriguing causal model.  It discloses that Americans drink a lot more soft drinks, watch a lot more TV, and have a far shorter school year than Japanese.  These three indicators may have causal implications on several health metrics: obesity rate, life expectancy, and health care cost.  They may also have implication in overall population IQ and prospective RGP p.c. forecast.

Below, I am just sharing a few references regarding the respective countries' IQ score. 


While the trends reviewed so far favor Japan, the next set of trends related to upper level education reflect a marked competitive advantage for the US. 

The US dominates the ranks of top universities. 


The US also produces a competitive number of Doctorate degrees in science and engineering. 


The US also publishes a competitive number of papers and articles in science and engineering. 


Compact Letter Display (CLD) to improve transparency of multiple hypothesis testing

Multiple hypothesis testing is most commonly undertaken using ANOVA.  But, ANOVA is an incomplete test because it only tells you ...