You can read the complete study at the following links:
DNN Stock Market Study at SlidesFinder
DNN Stock Market Study at Slideshare
Objectives:
We will test whether:
Data:
Quarterly data from 1959 Q2 to 2021 Q3. All variables are fully detrended as quarterly % change or first differenced in % (for interest rate variables). Models are using standardized variables. Predictions are converted back into quarterly % change.
Data sources are from FREDS for the economic variables, and the Federal Reserve H.15 for interest rates.
Software used for DNNs.
R neuralnet package. Inserted a customized function to use a smooth ReLu (SoftPlus) activation function.
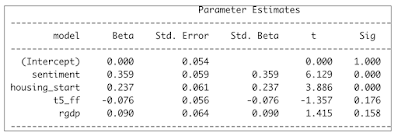
The variables within the underlying OLS Regression models are shown within the table below:
Consumer Sentiment is by far the most predominant variable. This is supported by the behavioral finance (Richard Thaler) literature.
Housing Start is supported by the research of Edward E. Leamer advancing that the housing sector is a leading indicator of overall economic activity, which in turn impacts the stock market.
Next, the Yield Curve (5 Year Treasury minus FF), and economic activity (RGDP growth) are well established exogenous variables that influence the stock market. Both are not quite statistically significant. And, their influence is much smaller than for the first two variables. Nevertheless, they add explanatory logic to our OLS regression fitting the S&P 500.
The above were the best variables we could select out of a wide pool of variables including numerous other macroeconomic variables (CPI, PPI, Unemployment rate, etc.) interest rates, interest rate spreads, fiscal policy, and monetary policy (including QE) variables.
Next, let's quickly discuss activation functions of hidden layers within sequential Deep Neural Networks (DNN) model. Until 2017 or so, the preferred activation function was essentially a Logit regression called Sigmoid function.
There is nothing wrong with the Sigmoid function per se. The problem occurs when you take the first derivative of this function. And, it compresses the range of values by 50% (from 0 to 1, to 0 to 0.5 for the first iteration). In iterative DNN models, the output of one hidden layer becomes the input for the sequential layer. And, this 50% compression from one layer to the next can generate values that converge close to zero. This problem is called the “vanishing gradient descent.”
Over the past few years, the Rectified Linear function, called ReLu, has become the most prevalent activation function for hidden layers. We will advance that the smooth ReLu, also called SoftPlus is actually much superior to ReLu.
SoftPlus appears superior to ReLu because it captures the weights of many more neurons’ features, as it does not zero out any such features with input values < 0. Also, it generates a continuous set of derivatives values ranging from 0 to 1. Instead, ReLu derivatives values are limited to a binomial outcome (0, 1).
Here is a picture of our DNN structure.
The balance of the DNN structure is appropriate. It is recommended that the hidden layers have fewer
nodes than the input one; and, that they have more nodes than the output layer. Given that, the choice of
nodes at each layer is just about predetermined. More extensive DNNs would not have worked anyway.
This is because the DNNs, as structured, already had trouble converging towards a solution given an
acceptable error threshold.
As expected the DNN models have much better fit with the complete historical data than the OLS
Regression.
As seen above, despite the mentioned limitation of the Sigmoid function, the two DNN models (SoftPlus
vs. Sigmoid) relative performances are indistinguishable. And, they are both better than OLS Regression.
But, fitting historical data and predicting or forecasting on an out-of-sample or Hold Out test basis are two
completely different hurdles. Fitting historical data is a lot easier than forecasting.
We will use three different Test periods as shown in the table below:
Each testing period is 12 quarters long. And, it is a true Hold Out or out-of-sample test. The training data
consists of all the earlier data from 1959 Q2 up to the onset of the Hold Out period. Thus, for the
Dot.com period, the training data runs from 1959 Q2 to 2000 Q1.
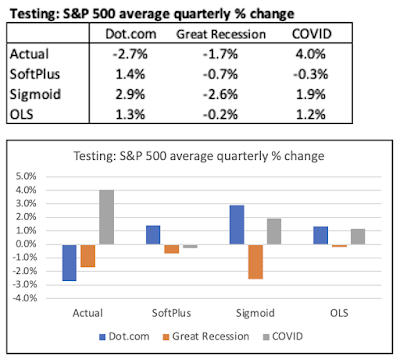
Without getting bogged down into attempting to fine tune model rankings between these three models, we can still derive two takeaways.
The first one is that the Sigmoid issue with the "vanishing gradient descent" did not materialize. As shown, the Sigmoid DNN model actually was associated with greater volatility in average S&P 500 quarterly % change than for the SoftPlus DNN model.
The second one is that the DNN models did not provide any prediction incremental benefits over the simpler OLS Regression.
So, why did all the models, regardless of their sophistication, pretty much fail in their respective predictions?
It is for a very simple reason. All the relationships between the Xs and Y variables are very unstable. The table below shows the correlations between such variables during the Training and Testing periods. As shown, many of the correlations are very different between the two (Training and Testing). At times, those correlations even flip signs (check out the correlations with the Yield Curve (t5_ff)).
The models' predictions failing is especially humbling when you consider that the mentioned 3-year Hold Out tests still presumed you had perfect information over the next 3 years regarding the four X variables. As we know, this is not a realistic assumption.


