Friday, April 15, 2022

Cryptocurrencies as an asset class

We are going to analyze several of the major cryptocurrencies as an asset class.  And, we are going to address several related questions:


1) Do they provide diversification benefits relative to the stock market (S&P 500)?
 
2) How do their diversification benefits compare with Gold’s diversification benefit vs. the stock market? 
 
3) Do cryptocurrencies provide diversification benefits when you really need it… during market downturns?

 4) Are cryptocurrencies truly “digital Gold”?  Do they behave in a similar way given that their supply is constrained (supposedly in a similar way as Gold is)?

You can review the complete analysis at the following links:  

Crypto analysis at Slideshare

Crypto analysis at SlidesFinder 

Publicly available data on cryptocurrencies is fairly limited in terms of length of time series.  Also, many cryptocurrencies started in just the past few years.  Given that, I am focusing the first part of this analysis on monthly data from September 2015 to March 2022.  I also conducted fairly extensive analysis using daily data that you can review within the links disclosed above. 

When looking at correlations over the reviewed period as shown on the table below, we observe that both cryptocurrencies and gold have very low correlations with the stock market (S&P 500). 


 Thus, one could derive that cryptocurrencies do provide diversification benefit from equity market risk.  

However, during the one market correction (within this period), we observe that cryptocurrencies did not provide any diversification benefits.  While the S&P 500 contracted by close to - 30% between February 19 and March 16, 2020, the cryptocurrencies' respective values often contracted by more than - 50%. 

As shown earlier, cryptocurrencies have very low correlations with gold.  Thus, they can't be considered "digital gold", as they behave completely differently. 

The critical differentiating characteristic of cryptocurrencies is their volatility.  Their volatility is a high multiple higher than the stock market (S&P 500).  The graph below is focused on the volatility level-dimension that is specified as the annualized standard deviation using monthly % change.  And, the Y-axis as disclosed, when it shows a standard deviation of 7.5 ... it actually means a standard deviation of 750% (as a reference the S&P 500 annualized standard deviation over that period averaged about 14%).  Within the complete analysis, you can see details of the underlying calculations.     


As shown above, both XRP and Dodge experienced the highest volatility with both peaks for several months at or above 750%.  

When we focus our graph on the time dimension (see below), we observe that XRP experienced its peak volatility in 2018.  Meanwhile, Dodge experienced it 3 years later in 2021. 

Next, let's look at the cryptocurrencies volatility (as defined) as a multiple of the S&P 500 volatility.  As shown on the graph below, these multiples range from single digit multiple up to > 200 x.  That's pretty amazing.  It is actually hard to comprehend unless you look at the underlying data firsthand. 

As we speak, the cryptocurrencies are experiencing a severe correction (far worse than any stock market correction).  While the S&P 500 has corrected by about - 6% during this recent Winter, the cryptocurrencies have dropped between - 30% and - 80% since their most recent peak (some cryptocurrencies have been on a volatile slide since May of 2021).  This is a second instance when cryptocurrencies have provided no diversification from equity risk.


In view of the above, cryptocurrencies may be considered an asset class given that their behavior is very much different from other asset classes (at least the ones reviewed including equities and gold; and they certainly behave completely differently than bonds.  You don't need a study to assess that). 

However, as mentioned they do not provide so far any diversification benefit to protect against equities markets downturns.  And, their huge volatility renders them inappropriate for any conservative and/or long-term investor.


Monday, March 21, 2022

Can you Deep Learn the Stock Market?

You can read the complete study at the following links:  


DNN Stock Market Study at SlidesFinder 

DNN Stock Market Study at Slideshare 


Objectives:

We will test whether: 


a) Sequential Deep Neural Networks (DNNs) can predict the stock market better than OLS regression;

b) DNNs using smooth Rectified Linear Unit activation functions perform better than the ones using Sigmoid (Logit) activation functions. 
 

Data:

Quarterly data from 1959 Q2 to 2021 Q3.  All variables are fully detrended as quarterly % change or first differenced in % (for interest rate variables).  Models are using standardized variables.  Predictions are converted back into quarterly % change.  


Data sources are from FREDS for the economic variables, and the Federal Reserve H.15 for interest rates.


Software used for DNNs.

R neuralnet package.  Inserted a customized function to use a smooth ReLu (SoftPlus) activation function.   


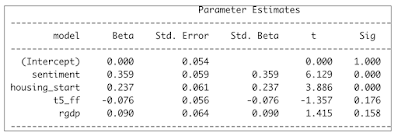
The variables within the underlying OLS Regression models are shown within the table below: 


Consumer Sentiment is by far the most predominant variable.  This is supported by the behavioral finance (Richard Thaler) literature.  


Housing Start is supported by the research of Edward E. Leamer advancing that the housing sector is a leading indicator of overall economic activity, which in turn impacts the stock market. 


Next, the Yield Curve (5 Year Treasury minus FF), and economic activity (RGDP growth) are well established exogenous variables that influence the stock market.  Both are not quite statistically significant.  And, their influence is much smaller than for the first two variables.  Nevertheless, they add explanatory logic to our OLS regression fitting the S&P 500. 


The above were the best variables we could select out of a wide pool of variables including numerous other macroeconomic variables (CPI, PPI, Unemployment rate, etc.) interest rates, interest rate spreads, fiscal policy, and monetary policy (including QE) variables. 


Next, let's quickly discuss activation functions of hidden layers within sequential Deep Neural Networks (DNN) model.  Until 2017 or so, the preferred activation function was essentially a Logit regression called Sigmoid function.


There is nothing wrong with the Sigmoid function per se.  The problem occurs when you take the first derivative of this function.  And, it compresses the range of values by 50% (from 0 to 1, to 0 to 0.5 for the first iteration).  In iterative DNN models, the output of one hidden layer becomes the input for the sequential layer.  And, this 50% compression from one layer to the next can generate values that converge close to zero.  This problem is called the “vanishing gradient descent.”  


Over the past few years, the Rectified Linear function, called ReLu, has become the most prevalent activation function for hidden layers.  We will advance that the smooth ReLu, also called SoftPlus is actually much superior to ReLu. 


SoftPlus appears superior to ReLu because it captures the weights of many more neurons’ features, as it does not zero out any such features with input values < 0.  Also, it generates a continuous set of derivatives values ranging from 0 to 1.  Instead, ReLu derivatives values are limited to a binomial outcome (0, 1). 


Here is a picture of our DNN structure. 


One input layer with 4 independent variables: Consumer Sentiment, Housing Start, Yield Curve, and RGDP. 
 
Two hidden layers.  The first one with 3 nodes, and the second one with 2 nodes.  Activation function for the two hidden layers are SoftPlus for the 1st DNN model, and Sigmoid for the second one.
 
One output variable, with one node, the dependent variable, the S&P 500 quarterly % change.  The output layer has a linear activation function. 
 
The DNN loss function is minimizing the sum of the square errors (SSE).  Same as for OLS.  
 

The balance of the DNN structure is appropriate.  It is recommended that the hidden layers have fewer 

nodes than the input one; and, that they have more nodes than the output layer.  Given that, the choice of 

nodes at each layer is just about predetermined.  More extensive DNNs would not have worked anyway.   

This is because the DNNs, as structured, already had trouble converging towards a solution given an 

acceptable error threshold. 


As expected the DNN models have much better fit with the complete historical data than the OLS 

Regression. 


As seen above, despite the mentioned limitation of the Sigmoid function, the two DNN models (SoftPlus 

vs. Sigmoid) relative performances are indistinguishable.  And, they are both better than OLS Regression.


But, fitting historical data and predicting or forecasting on an out-of-sample or Hold Out test basis are two 

completely different hurdles.  Fitting historical data is a lot easier than forecasting.


We will use three different Test periods as shown in the table below:


Each testing period is 12 quarters long.  And, it is a true Hold Out or out-of-sample test.  The training data 

consists of all the earlier data from 1959 Q2 up to the onset of the Hold Out period.  Thus, for the 

Dot.com period, the training data runs from 1959 Q2 to 2000 Q1.

 
The quarters highlighted in orange denote recessions.  We call the three periods, Dot.com, Great 
Recession, and COVID periods as each respective period covers the mentioned events.
 
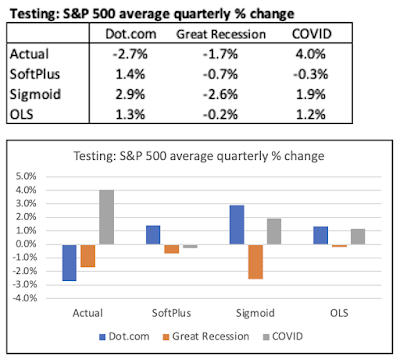
To visualize the models' respective prediction performance, we will use "skylines."  The column graph 
below looks like a set of skylines with vertical buildings for positive values and reflection in water for 
negative values.  Within the complete linked study, we show several other ways to convey the forecasting 
performance that you may prefer.  
 
 
As shown above, all the models predictions are really pretty dismal.  None of the models predicted the 
protracted 3-year Bear market associated with the Dot.com bubble.  At the margin, the OLS model
actually performed a bit better than the DNN models.  

Now, let's look at the Great Recession period.  In this situation, the models did better.  However, their 
overall predicting performance was nothing to write home about.  All models completely missed the 
severe market correction in the third year of the Great Recession period.  And, again the DNN models did 
not perform any better than the OLS Regression.

 
When focusing on the COVID period, the ongoing mediocrity (at best) of the models' prediction 
performance is readily apparent.  All models completely missed the robust Bull market in the third year of 
the COVID period (as defined).  Again, the DNN models did not fare any better than the simpler OLS 
Regression.  
 
If we look at average predictions for all three models for all three testing periods, we can get a quick 
snapshot of the competitiveness of the models. 
 

Without getting bogged down into attempting to fine tune model rankings between these three models, we can still derive two takeaways.  

The first one is that the Sigmoid issue with the "vanishing gradient descent" did not materialize.  As shown, the Sigmoid DNN model actually was associated with greater volatility in average S&P 500 quarterly % change than for the SoftPlus DNN model.   

The second one is that the DNN models did not provide any prediction incremental benefits over the simpler OLS Regression.  

So, why did all the models, regardless of their sophistication, pretty much fail in their respective predictions? 

It is for a very simple reason.  All the relationships between the Xs and Y variables are very unstable.  The table below shows the correlations between such variables during the Training and Testing periods.  As shown, many of the correlations are very different between the two (Training and Testing).  At times, those correlations even flip signs (check out the correlations with the Yield Curve (t5_ff)).  


The models' predictions failing is especially humbling when you consider that the mentioned 3-year Hold Out tests still presumed you had perfect information over the next 3 years regarding the four X variables.  As we know, this is not a realistic assumption.  


Thursday, March 3, 2022

Can Treasury Inflation Protected Securities (TIPS) predict Inflation?

 Treasury Yield - TIPS Yield = Inflation Expectation

The above basic equation allows to derive long term Inflation Expectation from the bond market.  By looking at the spread between Treasuries and TIPS of identical maturities, we can derive inflation expectation over a 5 year, 7 year, and 10 year horizon. 

The TIPS data is unfortunately very limited and starts only in 2003.  However, given that we deal with monthly observations the data is still associated with numerous data points. 

So back in 2003, we could derive annualized 5 year, 7 year, and 10 year inflation expectations by looking at the spread between the matching Treasuries and TIPS. 

In 2003, we derived annualized 5 year expectation over the 2003- 2008 period.  And, we compare this inflation expectation with the actual annualized 5 year inflation rate over this same 2003 - 2008 period observed in 2008.  So, when we graph this data, the first observation will start in 2008.  

When looking at the 7 year expectation, the framework is the same as the above.  And, when we graph this data, the first observation will start in 2010.  For 10 year inflation expectation, the first observation will be in 2013.

The complete study can be found at the following link: 

TIPS study at Slideshare  

TIPS study at SlidesFinder 

None of the TIPS derived inflation expectations turned out into effective predictions as shown on the scatter plots below. 


The scatter plots are more readily visible within the complete study.  Nevertheless, at a high level these three scatter plots disclose images of near randomness.  This is true whether you look at 5 year, 7 year, or 10 year horizons.  In all three cases, the underlying linear regressions have a slope and an R Square close to Zero denoting near randomness and absence of any material relationship between inflation expectation and actual inflation years later.

Here is looking at the 5 year horizon.


Here is looking at the 7 year horizon.

Here is looking at the 10 year horizon. 


All three graphs have a similar pattern with little relationship between inflation expectation and actual inflation.  This absence of relationship was precisely diagnosed using the scatter plots and underlying linear regressions above.  

When we combine the 3 sets of inflation predictions on the same graph, we can observe how bond investors reacted to the onset of the Great Recession back in 2008. 


The graph above discloses that back in 2008, the spread between Treasuries and TIPS over the 5 year, 7 year, and 10 year maturities resulted in inflation prediction associated with a deep deflationary environment.  We can observe that with the 3 deep negative spikes denoting negative inflation expectation over long periods of time starting back in 2008.  

Back in 2008, the negative inflation expectation over the 5 year horizon kicked in 2013 (blue line); 

Over the 7 year horizon it kicked in 2015 (red line); and 

Over the 10 year horizon it kicked in 2018 (gray line).  

Next, let's compare the combined inflation expectations as presented above vs. what happened: the actual inflation over those respective periods. 


As shown above, the actual annualized inflation rates look completely different from the matching annualized inflation expectations.  Within the actual data, there are no downward spike associated with a deflationary environment over several years (each monthly data point covers several years of data associated with the various maturities of the bonds: 5 year, 7 year, and 10 year).

There are considerations that the Federal Reserve (Fed) is a dominant investor in TIPS.  And, therefore the Fed may have distorted the resulting inflation expectation measure.  If that is the case, TIPS yields would be lower than otherwise.  And, the resulting inflation expectations would be higher than otherwise.  This is counter to the objective of the Fed.  But, this may be an unintended consequence that the Fed has not resolved.  

Looking at the data is rather ambivalent. 


The 7 year and 10 year maturities are supportive of the hypothesis that the Fed may have influenced the TIPS yields downward and indirectly the inflation expectations upward.  For both maturities, the inflation expectations are in average statistically significantly higher than actual inflation.  However, when looking the 5 year maturity, this is not the case; as actual inflation in average has been a bit higher than inflation expectation.  


Monday, February 28, 2022

How overvalued is the Stock Market?

Caveat: this analysis was conducted before the Russian invasion of Ukraine. 

You can find the complete analysis at the following two URLs:

Stock Overvaluation at Slideshare.net

Stock Overvaluation at SlidesFinder 

As a first cut, one looks at PE ratios and quickly infer that the Stock Market is much overvalued. 

Whether you look at a regular PE ratio or Shiller PE ratio (using 10 years of inflation adjusted earnings), PE ratios are pretty high right now.  But, on a stand alone basis a PE ratio does not tell you much if at all.  If the PE ratio of the S&P 500 is around 25, does it mean that stocks are expensive relative to bonds or other assets?  Does it mean that stocks are overvalued relative to the inflation rate or other economic indicators?  Frankly, you have no idea. 

To start our analysis, let's first look at whether stocks are overvalued or not relative to 10 Year Treasuries.  To render both investments comparable, we are going to flip the PE ratio upside down, and instead look at the EP ratio (Earnings/Price) that is commonly referred to as the Market Earnings Yield.  And, we are going to compare this Market EP with 10 Year Treasuries yield.  

As shown above, when we compare the S&P 500 earnings yield (EP) with 10 Year Treasuries yield (by dividing the former vs. the latter), we can observe that based on historical data the Stock Market appears relatively cheap or undervalued relative to 10 Year Treasuries yield. 

We can extend this analysis to all different types of bonds, and the result is the same.  Currently, stock are actually a lot cheaper than bonds. 

The table above shows on the first row that the EP multiple of 10 Year Treasury is currently 2.2.  It is much higher than the long term average of 1.3.  Also, the EP - 10 Year Treasury yield spread is 1.73%, which is 1.47% higher than the long term average of 0.27%.  Given that, stocks are currently a lot cheaper than 10 Year Treasuries.  And, the story is the same for 30 Year Treasuries, Moody's Baa corporate bonds, and S&P BB and B rated bonds.  Thus, despite the S&P 500 having a pretty high PE, stocks are actually really cheap relative to bonds.  But, does that mean that stocks are truly cheap or undervalued?  Or, that bonds are even more overvalued than stocks.  

The table below discloses that stocks and bonds are actually all rather extraordinarily expensive relative to the current inflation rate. 

Looking at the first column from the left, the S&P 500 Earnings Yield (EP) is - 3.65 percentage points lower than the inflation rate over the past 12 months.  And, that is - 3.64 standard deviation below the long term average for this spread that stands at + 2.17%.  Thus, from this standpoint the stock market is greatly overvalued.  Notice, that it is the same story for all the bonds.

One can reasonably argue that the stocks and bonds overvaluation is very much due to a one-off abrupt spike in inflation that should abate somewhat over the next year or so.    

In January 2022, inflation, measured as the 12 month change in CPI, jumped to 7.5%.  This was the highest inflation rate since the early 1980s.  

Next, let's look at a more stable measure of inflation.  It is also forward looking which makes it very relevant for the stock market.  That measure is the 10 Year Inflation Expectation derived by measuring the spread between regular 10 Year Treasuries and Inflation Indexed 10 Year Treasuries.  The current spread between the two is 2.45%, in line with long term average.  Now, let's look at the valuation of stocks and bonds relative to this inflation expectation measure. 

As shown, even using this more stable measure of inflation, stocks and bonds are still very much overvalued relative to inflation expectations. 

We can look at two linear regression models to explore in more detail how overvalued are stocks relative to inflation and inflation expectations. 

The linear regression on the left shows that given a current inflation rate of 7.5%, the estimated stock market EP is 9.0% vs. an actual figure of 3.83%.  For the mentioned reasons, we won't focus much on this model and this inflation measure.  Instead, we will focus more on the less volatile and more forward looking inflation expectation measure and the related model within the scatter plot on the right.  

The linear regression on the right shows that given a current 10 year inflation expectation of 2.45%, the estimated stock market EP is 5.33% vs. an actual figure of 3.83%.  Focusing on the 10 year inflation expectation measure, it would entail a potential market correction of: 3.83%/5.33% - 1 = - 28%.  Notice that this regression model is not that explanatory (R Square 0.27).  So, there is much uncertainty around this potential market correction estimate.  Nevertheless, the current EP of 3.83% is 1.4 standard error below the estimate of 5.33%, indicating that 92% of this regression model residuals are higher than for this current observation.  That is pretty far out on the left-tail.  


Compact Letter Display (CLD) to improve transparency of multiple hypothesis testing

Multiple hypothesis testing is most commonly undertaken using ANOVA.  But, ANOVA is an incomplete test because it only tells you ...