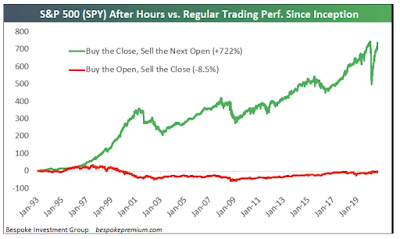
A friend of mine recently shared this arresting chart.
The above chart suggests that since the beginning of 1993, some large institutional investors extracted all the gains out of the S&P 500 by simply buying it at the Close of the previous day and selling it at the Open of the following day. Meanwhile, many retail investors (day-traders types) who would simply buy the S&P 500 at the Open and sell it at the Close during regular trading hours would have reaped no gain whatsoever going back to 1992!
The chart above was created by the Bespoke Investment Group. You can review their website at the link below.
For a better understanding of After Hours Trading, please refer to the following link.
After Hours Trading explanation
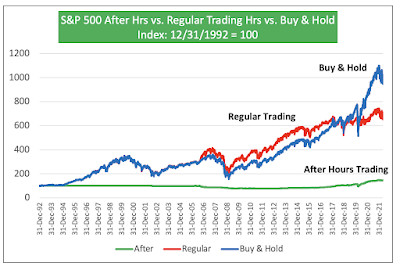
The above chart left me baffled. So, I extracted the relevant data from Yahoo Finance. And, I replicated this chart. And, all of a sudden the World still made sense. And, the Market is not rigged (at least on this one count).
As you can see on my chart above, the gains in the S&P 500 accrue to the ones who simply bought it at the Open and sold it at the Close during the regular trading hours. Meanwhile, the ones who would have traded after hours, overall did not reap any gain whatsoever. My chart looks very much like the one from Bespoke, except that in my chart the gains are associated with the regular trading hours. I gather, Bespoke simply confused the time series for After Hours Trading vs. Regular Hours Trading.
Next, I just added an extra time series to see how those strategies would compare vs. simply a Buy & Hold strategy.
As shown above, you can see that from beginning to end point, the Buy & Hold strategy is way ahead.
However, most of that advantage occurred in the past couple of years since the beginning of 2020 (blue line spikes upward much above the red line). During this period, the After Hours traders made some marginal gains (the Market on the next day at the Open was at times marginally higher than the Close of the previous day). And, those small gains compounded on a larger accrued value for the Buy & Hold strategy, allowed it to zoom passed the regular trading hour strategy.
The reverse was true during a long period from the end of 2006 to end of 2014, when the Buy & Hold strategy was hindered by the small losses in the S&P 500 between the Close of the previous day and the Open of the following day. During that period, you can see the red line (regular trading) steadily above the blue line (Buy & Hold). Afterwards, the two lines start to converge.
From the end of 1992 till the end of 2006, there was virtually no difference between Buy & Hold and Regular Trading hours (the blue and red lines overlap, so you just see the blue one). This entails that throughout that period, the S&P 500 opened the next day at the exact same value as the Close on the previous day.
Once you convey the S&P 500 data accurately, there is nothing that suggests that institutional investors who trade after hours extract any rent-profits from the Market.
Although this was not the main topic of this post, you have to note the superior efficiency of the Buy & Hold strategy on several counts. And, the "efficiency" has several dimensions.
First, from an operational standpoint, the Buy & Hold strategy allows you to avoid 506 trades per year (253 trading days x 2 trades per day).
Second, it is a lot more tax efficient. All the accrued value represents not taxed unrealized capital gains. Meanwhile, all gains under the other two strategies would be taxed as short-term gains at ordinary income tax rates.


No comments:
Post a Comment